Hi Reader,
Each spring, J.P. Morgan releases a helpful document they call their Guide to Retirement. It's packed with interesting ideas and data that are all focused on retirement. While I think the entire document is valuable, I've handpicked eight charts that I think can help us make better retirement decisions. I've also added some commentary that I hope you'll find valuable.
1.) Focus on what you can control
We talk a lot about focusing on the things within your control, so I love the visual below because it captures the level of control we have over various issues.
I want to specifically point out those in which we have zero control:
Market returns and broad tax/retirement policy changes.
It's critical to remember that the only intelligent way to address areas over which we have zero (or only partial) control is to think probabilistically. Historical probabilities are the only basis on which we can make educated planning decisions.
➡️ Learn more about Why the Right Questions Can Save Your Retirement.
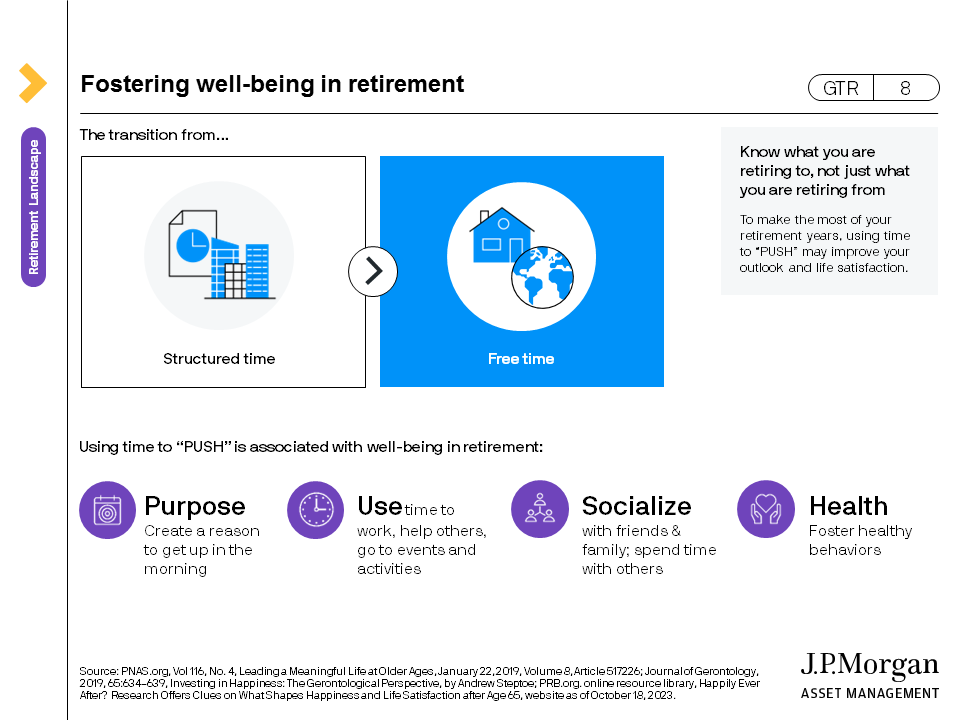
2.) Having a plan for how you will spend your time is often overlooked
In my experience, people spend much more time thinking about the financial side of retirement than they do about how they might spend their time.
You could argue that the latter is just as important, if not more so, since how you spend your time is how you'll spend your life.
As you plan your transition to "six Saturdays and a Sunday," I want to encourage you to follow the acronym PUSH below by considering how you might create purpose in your day-to-day life by using your time wisely.
A helpful mental exercise is to use these four building blocks as a guide for answering the question, "What does an ideal week in retirement look like for me?"
The more time you spend thinking about this question, the more likely you are to have a fulfilling retirement.
➡️ Learn more about Unveiling the Secrets to a Truly Successful Retirement for Women
3.) Generally speaking, spending declines over time
There's a helpful retirement catch-phrase that divides your retirement years into three distinct groups:
They are your "go-go years, slow-go years, and no-go years."
At its core, this phrase captures how you will likely spend your time and money throughout your retirement.
As just one example of the truth of this phrase, you're more likely to travel the world at age 70 than 90, which is one reason we tend to spend more early in retirement than later.
Obviously, how much your spending will change is unique to you, but the data offers a benchmark for how budgets evolve over time for many retirees.
4.) You'll probably live longer than you think
If you ask someone nearing retirement how long they think they'll live, most will probably respond early to mid-80s. This makes sense since it's their individual life expectancy.
The problem with this assumption is that, from a planning perspective, it misses the critical factor of "joint life expectancy." As a reminder, "joint life expectancy" is:
The age at which the second spouse would finally pass.
Surprisingly, for most healthy, non-smoking couples, life expectancy extends well into their 90s. More specifically, the data shows a 73% probability that at least one spouse will live to age 90 and an almost 50% probability of living to age 95.
And there's almost a 20% probability of living to age 100!
This is why I continually encourage thinking long-term when it comes to portfolio management in retirement since retirement may very well stretch more than three decades into the future.
➡️ Learn more about Unlocking the Secrets to a Healthy and Vibrant Retirement.
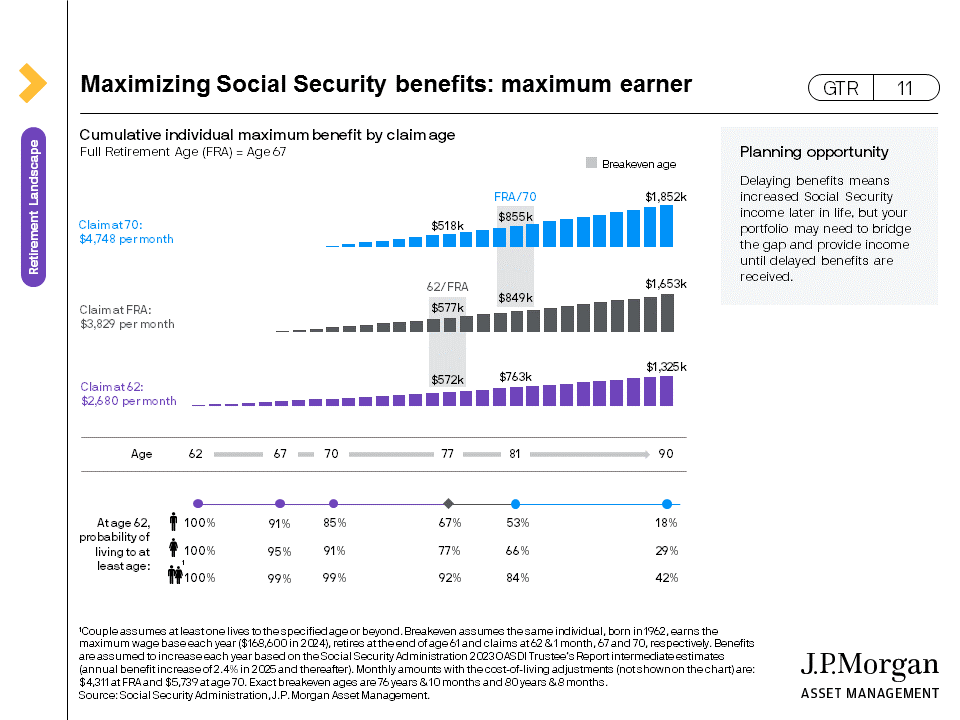
5. Social Security Breakeven Points
There's quite a bit of confusion around the age at which you might "come out ahead" based on when you file for social security.
Below, you'll find this information in visual form.
The short answer is:
People who wait until age 70 to collect benefits are ahead of all other filing options by about age 81.
Those who wait until Full Retirement Age are ahead of those who filed at age 62 by about age 77.
That's not to say that everyone should wait, but considering the life expectancies above, waiting can often be a prudent financial decision, especially for the higher-earning spouse.
➡️ Learn more about Top 5 Things Every Woman Should Know About Social Security.
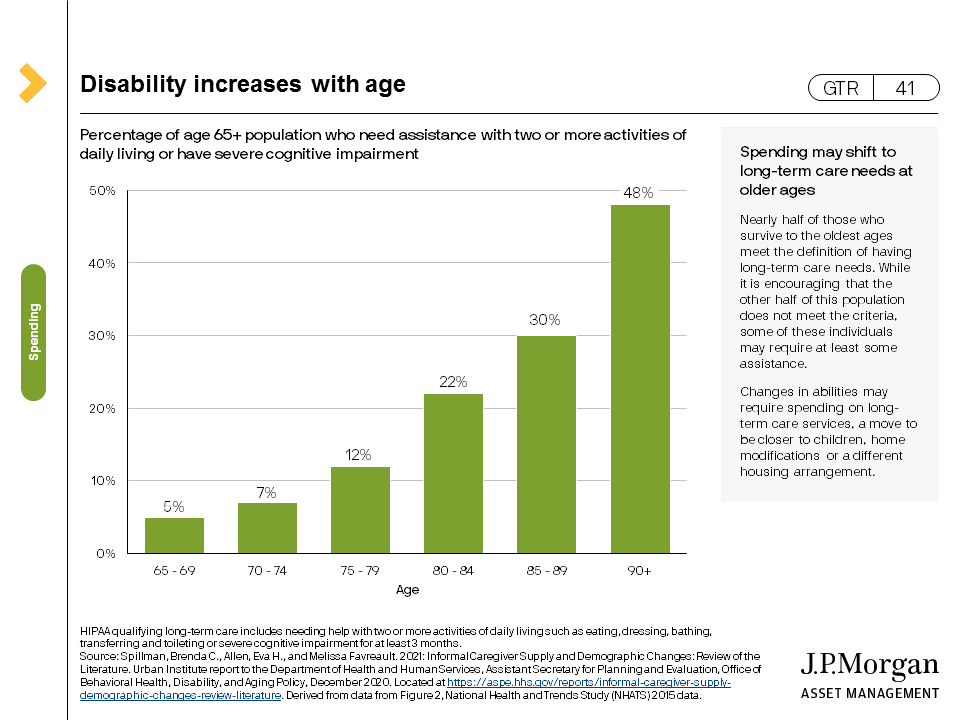
6.) The longer we live, the more likely we are to need some level of care
Another area I've noticed where expectations differ from reality is that most people underestimate the likelihood of requiring some level of care.
Remembering that at least one spouse may live well into their 90s, it's notable that almost 50% of people will be unable to accomplish two or more activities of daily living at age 90+.
In case you're curious, there are six activities of daily living:
Bathing, eating, dressing, toileting, transferring, and continence.
Given the life expectancies noted above and the probabilities below, this is why we spend time talking about and planning for these sorts of events. It's not a fun topic of discussion, but it is clearly important to be mentally and financially prepared.
➡️ Learn more about Unlocking the Secrets of Long-Term Care.
7. Being flexible with your spending can help your money last
While I generally disagree with the portfolio allocation noted below that's implied as appropriate for retirement, I wholeheartedly agree with the primary focus of this graphic.
While it's relatively intuitive that adjusting your spending based on market conditions can help your money last longer,
It can also provide more total spending throughout your retirement years.
I suspect most people would consider this to be a worthwhile tradeoff.
8.) Equity volatiliy has historically been a short-term risk
I want to draw your attention to the bottom half of the graphic below, which shows returns since 1950.
As you can see, equity volatility is high in the short term with a wide range of historical returns, as we've experienced many times before.
But over longer time periods—even considering periods as short as five years—the historical negative volatility of equities is very much in line with other asset classes with a positive skew notably in favor of equities.
Given that many retirees will experience a 30+ year retirement, we should never lose sight of the fact that the short-term volatility we can expect as equity investors has historically been well worth the long-term benefits.
➡️ Learn more about Seven Essential Strategies for Successful Investing in Retirement
As you consider the planning we're doing together and the decisions that lay before us, I hope these charts offer some insight into why we believe what we believe and plan the way we plan.
If any of these charts or thoughts provoke questions, please be encouraged to reach out.
And if you would like to learn more about our retirement planning services, schedule an introductory phone call.
Then, hit reply to this email with any questions. I read and respond to every message. 😃
Keeping Retirement Simple,
Eric Blake, CFP®
Thanks for subscribing! 📬
Not getting what you need? Unsubscribe